> ## Documentation Index
> Fetch the complete documentation index at: https://docs.lumovi.dev/llms.txt
> Use this file to discover all available pages before exploring further.

# Your clusters, at a glance

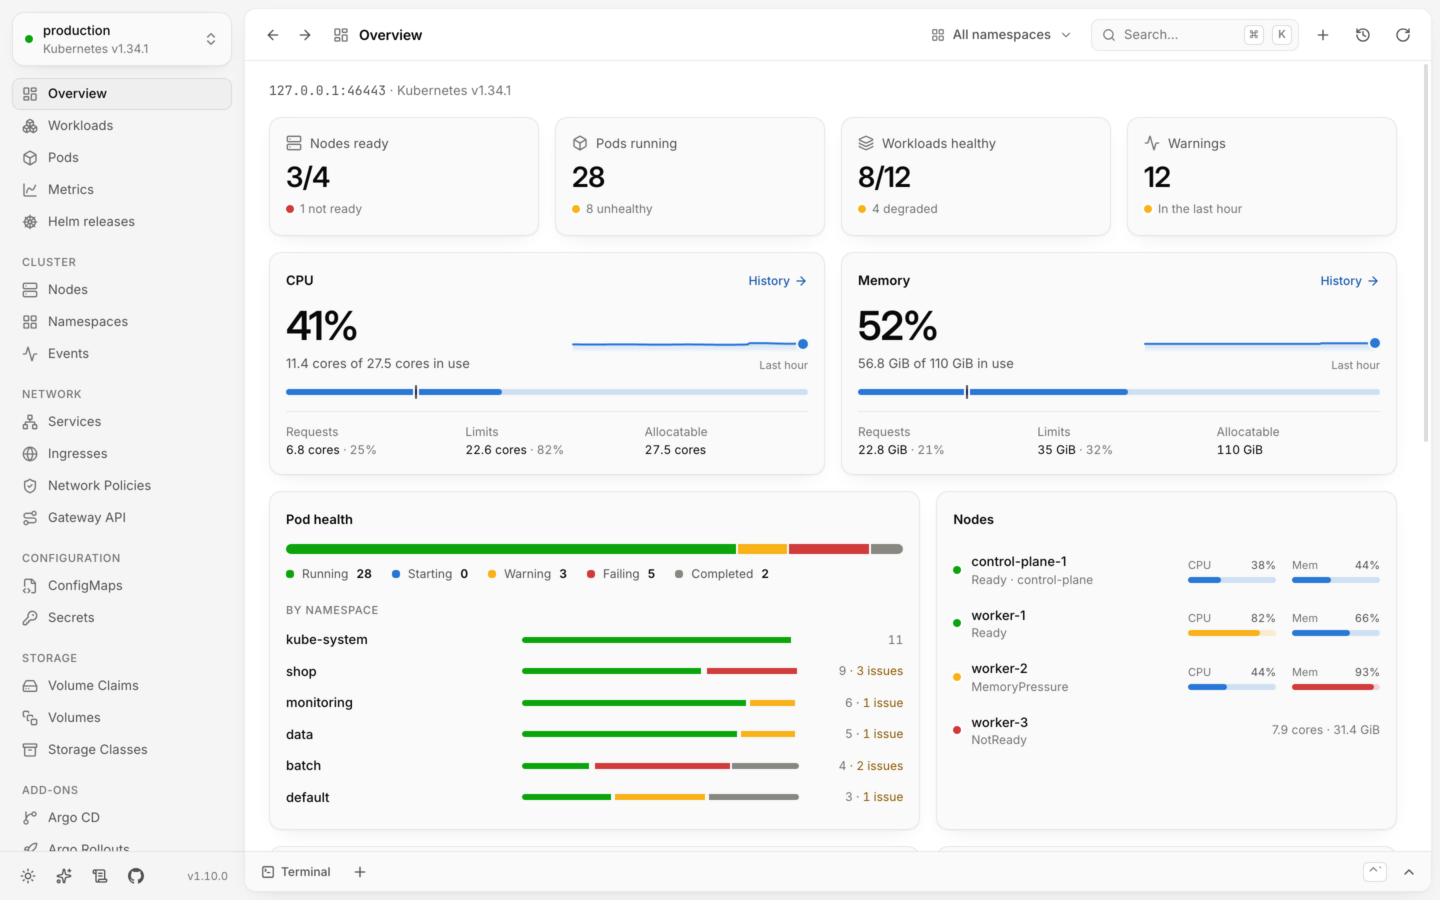
> Lumovi is a calm, fast Kubernetes dashboard that shows what's healthy, what's struggling and where your capacity goes, and lets you fix things safely.

<div className="lumovi-hero">
  <img className="block dark:hidden" loading="lazy" src="https://cdn.jsdelivr.net/gh/Lumovi/Lumovi@main/docs/screenshots/overview-light-1x.webp" alt="A cluster's overview in Lumovi: nodes, pods and workloads, CPU and memory with their last hour, and what needs attention." />

  <img className="hidden dark:block" loading="lazy" src="https://cdn.jsdelivr.net/gh/Lumovi/Lumovi@main/docs/screenshots/overview-dark-1x.webp" alt="A cluster's overview in Lumovi: nodes, pods and workloads, CPU and memory with their last hour, and what needs attention." />
</div>

Most Kubernetes tools are either a terminal or a wall of tables. Lumovi surfaces problems first, shows live usage next to what's allocatable, and gets out of your way. When something needs a hand (a scale, a restart, a rollback, a drain) it's a click or a keystroke away, with guard rails.

## Two ways to run it

It's the same app either way. Pick the one that fits, or use both.

<Columns cols={2}>
  <Card title="On your desktop" icon="monitor" href="/get-started/desktop" cta="Install the app">
    A native app for macOS, Windows and Linux. It reads your kubeconfig, like `kubectl`, and opens any cluster in it.
  </Card>

  <Card title="In your cluster" icon="server" href="/get-started/in-your-cluster" cta="Install with Helm">
    One Helm chart serves Lumovi as a web dashboard. Your team opens a link, signs in, and sees what their own RBAC allows.
  </Card>
</Columns>

<Tip>
  Joining a team that already runs Lumovi? You don't need to install anything. See [Signing in](/get-started/sign-in).
</Tip>

## What it does

<Columns cols={3}>
  <Card title="Health first" icon="heart-pulse" href="/explore/health">
    Every object gets a clear status, and problems sort to the top.
  </Card>

  <Card title="Usage next to capacity" icon="gauge" href="/metrics/live-usage">
    Live CPU and memory against requests, limits and what's allocatable.
  </Card>

  <Card title="A map of every object" icon="waypoints" href="/explore/map">
    What leads to it, from gateway to service, and what it uses and runs on.
  </Card>

  <Card title="Safe changes" icon="shield-check" href="/changes/safely">
    Scale, restart, roll back or drain, with the `kubectl` command shown, and undo.
  </Card>

  <Card title="Logs, merged" icon="scroll-text" href="/debug/logs">
    Every pod of a workload in one stream, in the order lines were written.
  </Card>

  <Card title="Shells and debugging" icon="square-terminal" href="/debug/shell">
    A shell in any container, or a debug container in pods that have none.
  </Card>

  <Card title="Usage history" icon="chart-area" href="/metrics/usage-history">
    Charts from your Prometheus or VictoriaMetrics, found for you.
  </Card>

  <Card title="Right-sizing" icon="scale" href="/metrics/right-sizing">
    What each workload should request, from a week of its usage, and why.
  </Card>

  <Card title="Helm releases" icon="package" href="/helm/releases">
    Values, revisions and diffs, read in place. Upgrade with a dry run first.
  </Card>

  <Card title="Custom resources" icon="puzzle" href="/custom-resources/overview">
    Every kind the cluster serves, with a status and the actions that matter.
  </Card>

  <Card title="Add-ons" icon="package" href="/custom-resources/add-ons">
    A page for each tool your cluster runs, from Argo CD and cert-manager to Velero.
  </Card>

  <Card title="Keyboard first" icon="command" href="/reference/keyboard-shortcuts">
    <kbd>⌘</kbd><kbd>K</kbd> goes anywhere, and the pages you use most have a shortcut.
  </Card>
</Columns>

## Made for the day something breaks

<AccordionGroup>
  <Accordion title="Problems come first" icon="arrow-up-narrow-wide">
    Lists sort by health, so you won't scroll past 400 healthy pods to find the one that isn't. The overview lists what needs attention and the latest warnings. Statuses always come with an icon and a label, never color alone. [How health works](/explore/health).
  </Accordion>

  <Accordion title="Nothing surprising" icon="eye">
    Every change names the cluster and shows the equivalent `kubectl` command. YAML edits are checked by the cluster with a dry run and shown as a diff before they're saved. [Changing things safely](/changes/safely).
  </Accordion>

  <Accordion title="Hard to do by accident" icon="lock">
    Lumovi asks the cluster what you're allowed to do before offering it. Risky deletes, and deletes in a cluster named like production, ask you to type the name first. [Read-only mode](/changes/read-only) turns changes off entirely.
  </Accordion>

  <Accordion title="Calm when things go wrong" icon="cloud-off">
    A lost connection shows a banner and keeps the last data on screen, instead of a blank window. Every error says what happened and what to try. [Troubleshooting](/reference/troubleshooting).
  </Accordion>

  <Accordion title="Built for big clusters" icon="layers">
    Lists load in chunks of 500 and are paginated and virtualized, so thousands of pods stay smooth. A label selector narrows a list on the server.
  </Accordion>
</AccordionGroup>

## Requirements

<div className="lumovi-facts">
  <div><span className="lumovi-label">Kubernetes</span><span className="lumovi-value">1.25 or later</span></div>
  <div><span className="lumovi-label">kubectl</span><span className="lumovi-value">Not needed</span></div>
  <div><span className="lumovi-label">Helm</span><span className="lumovi-value">Only to change releases</span></div>
  <div><span className="lumovi-label">Desktop</span><span className="lumovi-value">macOS 13+, Windows 10+, 64-bit Linux</span></div>
</div>

Live usage needs [metrics-server](https://github.com/kubernetes-sigs/metrics-server), and usage history needs a Prometheus or VictoriaMetrics in the cluster. Everything else works without them, and without metrics-server, Lumovi shows requests and limits against capacity instead.

## Free and open source

Lumovi is free under the Apache 2.0 license, with no telemetry and no accounts. It talks to your clusters, and otherwise only to GitHub to look for new versions (which you can turn off), to Artifact Hub when you search it for charts, and to the chart repositories and registries you install or upgrade from. See [Privacy and security](/reference/privacy-and-security).
<Columns cols={2}>
  <Card title="Star it on GitHub" icon="star" href="https://github.com/Lumovi/Lumovi" horizontal>
    Source, issues and releases.
  </Card>

  <Card title="Sponsor its development" icon="heart" href="https://github.com/sponsors/kotapeter" horizontal>
    Made in spare time. Sponsoring keeps it going.
  </Card>
</Columns>


This documentation is built and hosted on [Mintlify](https://mintlify.com), a developer documentation platform.