

kubectl logs -f. For a workload, you get every pod’s logs in one list, in the order the lines were written, each marked with its pod.
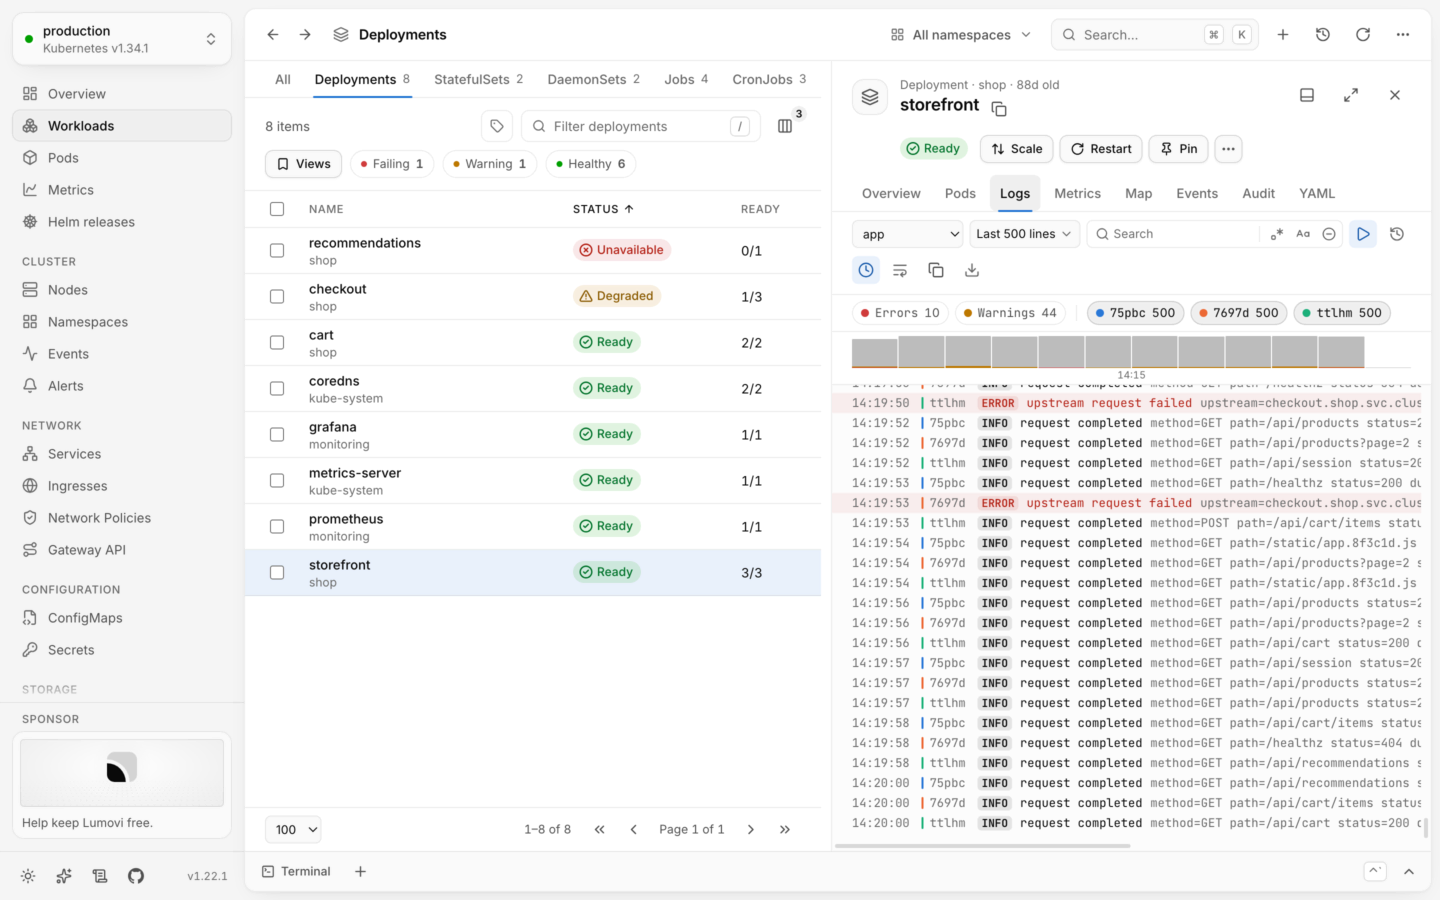

The logs of every pod of a deployment, merged as they happened.
Where logs are
Open an object, then its Logs tab:- A pod shows its own containers’ logs.
- A Deployment, StatefulSet, DaemonSet, ReplicaSet, Job or Service shows the logs of all its pods, merged. So do custom workloads that scale pods, like Argo Rollouts.
In your cluster: where your access doesn’t let you read logs, the Logs tab says You can’t read logs here, and why.
Pick what to show
Read them
When you scroll up to read, or step to a search’s match, the view stops jumping to new lines, and Follow shows as off meanwhile. Jump to latest, or Follow, takes you back down. A search, a level or a pod narrowing the lines, or showing them all again, keeps the newest line in view.
- Colors. The colors and styles apps print with ANSI escape codes show as they would in a terminal: 16, 256 and true colors, bold, dim, italic and underline. Other escape codes are left out.
- JSON lines. Structured lines show their level as a badge, then the message, then the other fields, dimmed, as
key=value.
From any time
Show → Since… takes a time ago, like90m, 2h or 3d, up to 30 days, or a time of day or a date and time, like 14:30 or 2026-10-11 09:00, in your own time. Before you choose Show, it reads it back to you: “From 12:58 today, 90 minutes ago, your time (UTC+2).” A time still to come, or one it can’t read, says so. The picker then names it, like Last 90 minutes or Since 09:00 yesterday. On a phone, a tap fills in 15m, 2h, 6h or today’s 00:00.
A span keeps at most 20,000 lines. With more, it shows the last 20,000 and says so: “Showing the last 20,000 lines since 09:00 yesterday. Pick a later time to see every line from it.” With several containers, each keeps its own share of them, at least 2,000, so a busy one doesn’t crowd out a quiet one; a note says which were cut.
Search and filter
- Search finds lines that contain what you type, ignoring case. Matches are highlighted, and the field counts them: 12 matches, or 3 of 12 once you step to one with ↵ (⇧↵ goes back), or the arrows beside it. Esc clears it.
-
Three toggles in the field change how it searches, each with a key that works while you’re typing:
Where your keyboard types a letter with that key, like
ćwith ⌥C on a Polish Mac, the key types it, and the toggle’s tooltip leaves the key out. Lumovi remembers the toggles for every Logs view; what you typed stays with the view while the page is open, never shared with another view. - An expression that isn’t one says why, like “This isn’t a regular expression: a ( isn’t closed.”, and the lines stay as the last search left them, dimmed. So does a search that takes too long: one that takes more than a second over the lines is stopped, with “This expression took too long on 20,000 lines, so Lumovi stopped it. Try a simpler one.” It runs apart from the page, so the page never stops answering while it does.
- Errors and Warnings appear when there are such lines, with a count. Press one to show only those lines; with neither pressed, every line shows.
- A chip per pod appears when there are several pods, with the part of the names they share left out. Press one to leave that pod’s lines out; it shows crossed out until you press it again.
Lines over time
Wider than a phone, a strip under the search shows how many lines were written over time, errors and warnings marked in each bar; hover a bar for its time and counts. Drag across it to show only the lines of that stretch: a chip says which, like 14:02–14:09, and its × shows all times again. Picking a stretch stops Follow, so new lines don’t pass it by. With the keyboard, move along the bars with the arrow keys, hold ⇧ to make a stretch, and press ↵; Esc lets it go. It’s drawn once the lines span at least two minutes. Lumovi reads a line’s level from itslevel field when it has one ("level":"warn" in JSON, or level=WARN). Otherwise it looks for words in the line:
Copy and download
Copy logs and Download take the lines you’re looking at, filters applied, one per line, each starting with the time it was written. When the lines come from several pods or containers, each also names its pod and container:checkout.log, and end in -filtered, like checkout-filtered.log, when they’re only part of the log: a search, a level, a pod left out, or a stretch of time. The desktop app asks where to save them, starting in your Downloads folder; in a browser, they download like any other file.
Limits
- 20,000 lines. The view keeps the latest 20,000 lines, and drops the oldest. It says so when it does: “Showing the latest 20,000 lines.” A span from Show is cut the same way: see From any time.
- 30 streams. A workload’s logs stream from at most 30 containers at once. With more, a note says so: pick a container, or open a single pod, to see the rest.
When the stream drops
While following, if a container restarts or the connection drops, Lumovi tries again after a few seconds, picking up from the last line it has, without repeating lines. The view says Trying again… meanwhile. Problems that trying again won’t fix, like expired credentials or missing permissions, are shown instead.Reading logs needs
get on pods/log in the pod’s namespace. Logs work in read-only clusters.Shells and debug containers
When the logs aren’t enough: a terminal in the container.
Health and status
Why a pod is failing, before you open its logs.