

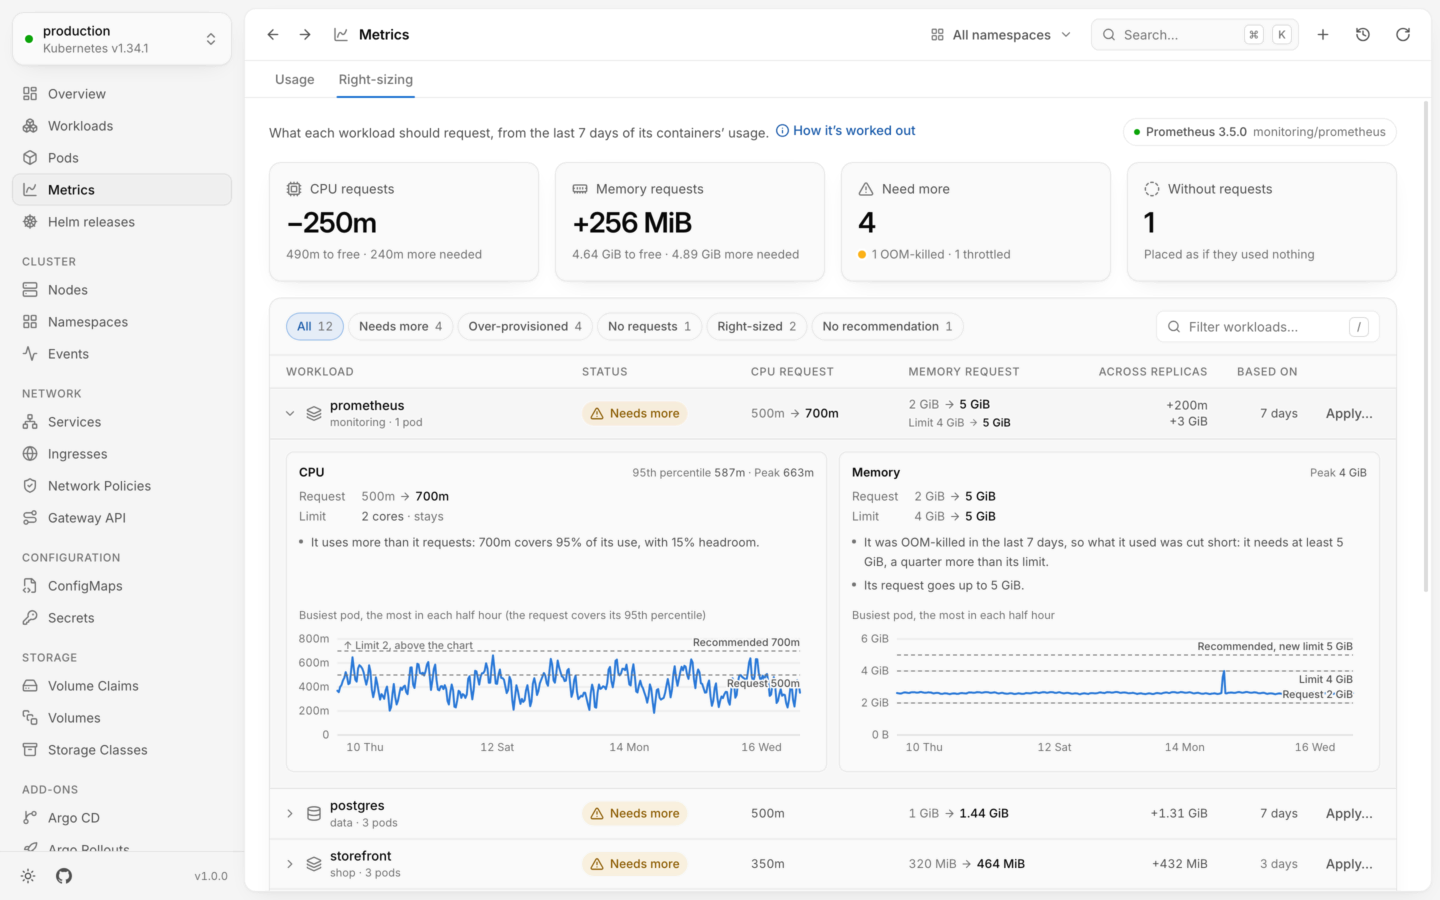

What each workload should request from a week of usage, with why, and its week against the request, the recommendation and the limit.
Open it
Open Metrics from the sidebar, or press G then U, and choose the Right-sizing tab, next to Usage. Or press ⌘K and type “right-sizing”. (⌘ is Ctrl on Windows and Linux.) The page follows the namespace menu: pick a namespace to see only its workloads. The filter, the order and the search are kept in the page’s address, so Back and Forward restore them.What you need
- Usage history. The same Prometheus or VictoriaMetrics the Metrics page charts from, found or chosen the same way. Without it, the page says why, as the charts do.
- A week of it, ideally. Recommendations look at the last 7 days. A workload needs a day of history before Lumovi recommends anything, and more of the week makes for a surer recommendation, so keep at least 7 days of history.
- cAdvisor’s metrics, scraped: CPU and memory use, and how often CPU limits throttle (
container_cpu_cfs_periods_totalandcontainer_cpu_cfs_throttled_periods_total). kube-prometheus-stack scrapes them out of the box. - kube-state-metrics, to see OOM kills over the whole week. Without it, Lumovi still sees an OOM kill in the last state of the pods running now.
- Permission to read.
liston Deployments, StatefulSets, DaemonSets, pods and HorizontalPodAutoscalers where you look,liston nodes across the cluster, andliston VerticalPodAutoscalers when the cluster has them. Plus what usage history needs. - Permission to apply.
patchon the workload’s kind in its namespace.
The summary
Four tiles sum up the workloads in view.The workloads
Each workload gets a status:
They’re listed in that order, so what needs attention comes first. Within a status, the biggest changes come first, with CPU and memory weighed by how much of the cluster they are.
Chips above the list show only the workloads with one status, with a count each: All, Needs more, Over-provisioned, No requests, Right-sized, and No recommendation for the last three. Filter workloads… finds workloads by name, namespace or kind.
Apply…, at the end of a row, applies its recommendation. Click anywhere else in the row to see why.
How it’s worked out
Recommendations follow the method the Kubernetes Vertical Pod Autoscaler’s recommender is built on, made conservative and explainable. How it’s worked out, at the top of the page, sums it up. Lumovi looks at every pod a workload had in the week, including ones that are gone, like those a rollout replaced: it knows a workload’s pods by their names.CPU
A container that needs more CPU than it requested is only slowed down. So its request covers the 95th percentile of its use, measured over 5 minutes at a time, in its busiest pod, with 15% headroom. The busiest pod, because a request is the same for every pod, and each should fit.Memory
A container that needs more memory than it can have is killed. So its request covers its peak over the week, in its busiest pod, with 15% headroom.Rounding
Recommendations are rounded up to amounts that read well. CPU goes in steps of 5m up to 100m, 10m up to 500m, 25m up to 1 core, 50m up to 4 cores, and 100m beyond. Memory goes in steps of about a sixteenth of the amount, like400Mi, 1472Mi or 3840Mi. Nothing goes below 10m of CPU or 32 MiB of memory.
When a limit held it back
What a container used under a limit understates what it needed:- It was OOM-killed in the last 7 days. Its memory request goes up to at least a quarter more than its limit, or than its peak if it has no limit, and its limit goes up with it. Its memory is never lowered.
- Its CPU limit throttled it in 10% or more of its CPU periods. The limit goes up by half, or to its peak with 20% room, whichever is more. When its usual use was held at the limit too, its request isn’t lowered either.
- Its peak memory is within 10% of its limit, a spike away from an OOM kill. The limit goes up to its peak with 15% headroom.
Limits
Limits are never lowered. What a lower limit would do, throttling and OOM kills, happens in bursts that a week of samples averages away. They only go up: when they hold a container back, as above, and to stay at or above its new request. A container without a limit doesn’t get one. A container with a limit but no request gets its limit as its request, as Kubernetes does, and the recommendation starts from there. When a request equal to its limit is lowered, the pods become Burstable rather than Guaranteed, and the reasons say so.Autoscalers
- HorizontalPodAutoscaler. Requests it scales on stay as they are: its utilization targets are percentages of them, so changing them would change when it scales. That’s CPU and memory with Utilization targets, and CPU for an autoscaler without metrics of its own. Targets in absolute amounts (AverageValue) leave requests free to change.
- VerticalPodAutoscaler. A workload one manages, in any update mode but
Off, is left to it, and shows Autoscaled.
What’s left alone
- Small changes. A change of less than 20%, or less than 25m of CPU or 32 MiB of memory, isn’t worth a rollout: the request stays.
- Init containers, and containers injected at runtime, like a service mesh’s proxy, which aren’t in the workload’s pod template. Both are left as they are.
- Containers with no usage in the last 7 days. The recommendation names them.
History
A workload’s history counts from the first sample of its longest-running container in the week, up to 7 days, and shows under Based on. With less than a day, Lumovi recommends nothing yet. With less than about a week (six days), a busier day may not be in it yet, so Based on is grayed out, and its tooltip says so. From then on, the week’s cycles are in it.A recommendation, up close
Click a row to open its recommendation. Each container gets a CPU and a Memory panel, under its name when the workload has several:- What was measured: the 95th percentile and Peak of its CPU, the Peak of its memory.
- Request and Limit, now and as recommended, like 2 GiB → 5 GiB, or stays when one doesn’t change.
- The reasons, in sentences, like It was OOM-killed in the last 7 days, so what it used was cut short: it needs at least 5 GiB, a quarter more than its limit.
- Its week: the busiest pod’s use, the most in each half hour, with lines for the Request, the Recommended request, the Limit and the New limit. Lines at the same value share a label. Hover the chart, or focus it and use ← →, to read values. These charts don’t zoom.
Apply a recommendation
Apply… opens Right-size name. It lists each change, a request or a limit of a container, with its value now and after. Untick any you’d rather leave as they are. Before anything changes, Lumovi sends the change to the API server as a dry run, so quotas, LimitRanges and admission webhooks have their say. Checking the change with the API server… becomes The API server accepts this change (checked without saving it). If the API server refuses it, the dialog shows why, like an exceeded quota, and Apply stays disabled. It checks again whenever you tick or untick a change. The dialog also says:- What happens to the pods. Its pods are replaced with the new resources, following its rollout strategy. A StatefulSet or DaemonSet with the
OnDeleteupdate strategy keeps its pods’ resources until they’re deleted. - What it frees or needs, across its pods: Across its 3 pods, it frees 300m of CPU and 1.5 GiB of memory.
- Under Equivalent command, one
kubectl set resourcesper container:
When something’s wrong
- Prometheus couldn’t answer for some namespaces. Lumovi asks for a week of one namespace at a time, two at once, so a big cluster stays within what Prometheus loads for one query, and answers in time. When some namespaces fail, the others still get recommendations, and the failed ones’ workloads show No usage. Try again asks again. A namespace that keeps failing is usually more than your Prometheus’s query limits or timeout allow.
- An error instead of the page, with Try again: the workloads couldn’t be listed, or Prometheus failed for every namespace.
- Nothing to right-size: there are no Deployments, StatefulSets or DaemonSets in the namespace you picked.
Usage history
Where the history comes from, and the Usage tab.
Undo and activity
Take a change back, and see every change you made.